Petrol Price 2014 vs 2026: Year-Wise Rates in Delhi, Mumbai, Kolkata & Chennai
From ₹71 to ₹102 in Delhi and ₹80 to ₹111 in Mumbai. Here’s every year’s petrol price across India’s four metros, the real yearly inflation rate, the record highs and lows, and why prices moved the way they did.
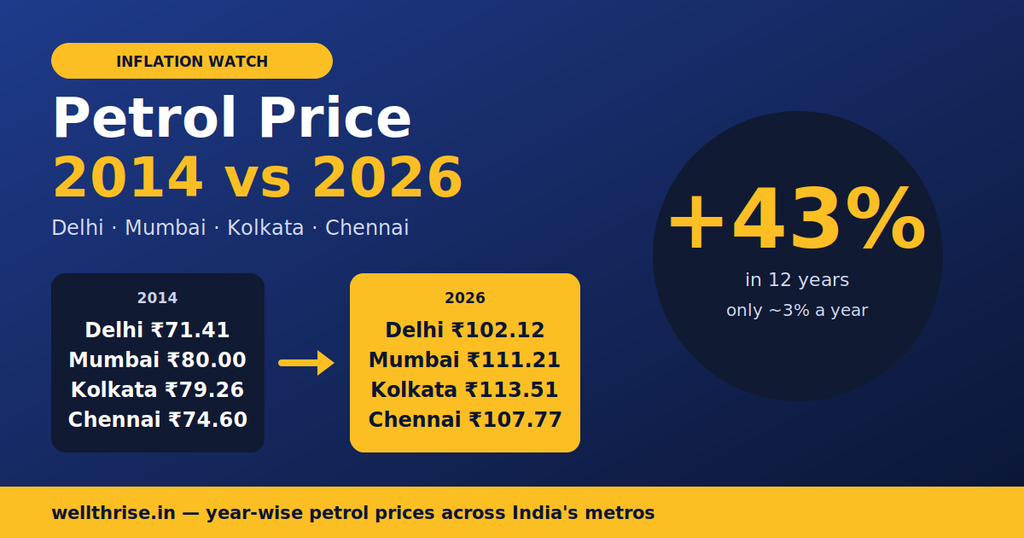
In May 2014, a litre of petrol cost ₹71.41 in Delhi and ₹80 in Mumbai. On October 1, 2026, it costs ₹102.12 and ₹111.21. That feels like a huge jump, and it is: roughly ₹31 more per litre. But spread across 12 years, it works out to about 3% a year. That’s slower than the general rise in prices over the same period.
The average hides a wild ride: a crash to ₹56 in 2015, a pandemic-era surge past ₹100, a four-year freeze, and a ₹7 jump in just ten days in May 2026. This post compares petrol prices from 2014 to 2026, year by year, across India’s four metros, using official oil-industry data.
Petrol Price 2014 vs 2026: The Four Metros Side by Side
Delhi
Mumbai
Kolkata
Chennai
2014 prices as of May 13, 2014; 2026 prices as of October 1, 2026 (IOC retail prices).
📊 The surprising takeaway: Petrol’s compound growth from May 2014 to October 2026 works out to about 2.7–3.0% a year across the four metros. Mumbai rose the least (2.7%), and Chennai the most (3.0%). India’s general consumer inflation averaged roughly 5% a year over the same stretch, so in real terms, petrol actually got slightly cheaper.
Petrol Prices Year by Year (2014–2026)
| Year | Avg price (₹/litre) | Change vs previous year |
|---|---|---|
| 2014 | 69.98 | — |
| 2015 | 61.94 | ▼ 11.5% |
| 2016 | 62.88 | ▲ 1.5% |
| 2017 | 68.49 | ▲ 8.9% |
| 2018 | 75.61 | ▲ 10.4% |
| 2019 | 72.36 | ▼ 4.3% |
| 2020 | 76.94 | ▲ 6.3% |
| 2021 | 96.19 | ▲ 25.0% |
| 2022 | 97.68 | ▲ 1.5% |
| 2023 | 96.72 | ▼ 1.0% |
| 2024 | 95.13 | ▼ 1.6% |
| 2025 | 94.77 | ▼ 0.4% |
| 2026* | 98.39 | ▲ 3.8% |
Time-weighted yearly averages from PPAC’s official price revisions. *2026 is January 1 – October 1.
| Year | Avg price (₹/litre) | Change vs previous year |
|---|---|---|
| 2014 (May) | 80.00 | — |
| 2017† | 76.62 | — |
| 2018 | 82.78 | ▲ 8.0% |
| 2019 | 78.00 | ▼ 5.8% |
| 2020 | 83.27 | ▲ 6.8% |
| 2021 | 103.09 | ▲ 23.8% |
| 2022 | 110.01 | ▲ 6.7% |
| 2023 | 106.31 | ▼ 3.4% |
| 2024 | 104.25 | ▼ 1.9% |
| 2025 | 103.50 | ▼ 0.7% |
| 2026* | 107.32 | ▲ 3.7% |
†June 16 – December 31, 2017 average. Official daily city data starts June 2017; 2015–2016 city-wise figures aren’t in the official daily series. *2026 is January 1 – October 1.
| Year | Avg price (₹/litre) | Change vs previous year |
|---|---|---|
| 2014 (May) | 79.26 | — |
| 2017† | 70.80 | — |
| 2018 | 78.11 | ▲ 10.3% |
| 2019 | 74.73 | ▼ 4.3% |
| 2020 | 79.02 | ▲ 5.7% |
| 2021 | 97.37 | ▲ 23.2% |
| 2022 | 107.03 | ▲ 9.9% |
| 2023 | 106.03 | ▼ 0.9% |
| 2024 | 104.88 | ▼ 1.1% |
| 2025 | 105.27 | ▲ 0.4% |
| 2026* | 109.42 | ▲ 3.9% |
†June 16 – December 31, 2017 average. *2026 is January 1 – October 1.
| Year | Avg price (₹/litre) | Change vs previous year |
|---|---|---|
| 2014 (May) | 74.60 | — |
| 2017† | 70.45 | — |
| 2018 | 78.48 | ▲ 11.4% |
| 2019 | 75.15 | ▼ 4.2% |
| 2020 | 80.05 | ▲ 6.5% |
| 2021 | 96.99 | ▲ 21.2% |
| 2022 | 103.54 | ▲ 6.8% |
| 2023 | 102.63 | ▼ 0.9% |
| 2024 | 101.14 | ▼ 1.5% |
| 2025 | 100.80 | ▼ 0.3% |
| 2026* | 104.26 | ▲ 3.4% |
†June 16 – December 31, 2017 average. *2026 is January 1 – October 1.
The 6 Moments That Shaped Petrol Prices
The crude crash
Global oil prices collapsed, and Delhi petrol fell from ₹73.60 (July 2014) to ₹56.49 (February 2015), its lowest point in this period.
Daily pricing begins
Fortnightly price revisions gave way to daily changes, which is why prices now move in paise almost every morning.
The first ₹80+ era
Rising crude pushed Mumbai petrol past ₹80 in January 2018. By October 4, 2018, it hit ₹91.34 in Mumbai and ₹84 in Delhi.
The ₹100 barrier breaks
The biggest yearly jump in this data, about 25%. Delhi hit ₹110.04 in November 2021, its all-time high.
The long freeze
After peaking in April 2022 (Mumbai ₹120.51, Kolkata ₹115.12, Chennai ₹110.85), prices barely moved for four years, with only a ₹2 cut in March 2024.
The West Asia shock
After crude jumped over 50% following strikes on Iran and disruption in the Strait of Hormuz, petrol rose in four steps from May 15 to 25, taking Delhi from ₹94.77 to ₹102.12.
Why Petrol Is Priced Differently in Each Metro
The same litre of petrol costs about ₹11 more in Kolkata than in Delhi. The base price from the refinery is similar everywhere. The difference comes from what’s added on top:
State VAT
Each state sets its own VAT on petrol. It’s the main reason Mumbai, Kolkata and Chennai cost more than Delhi.
Central excise duty
The Centre’s duty on petrol rose from ₹9.48 a litre in 2014 to a peak of ₹32.98 in 2020, before cuts brought it down to ₹19.90 in 2022.
Freight & dealer commission
Transport costs and the pump dealer’s margin add a smaller amount that also varies by city.
Crude & the rupee
International crude prices and the rupee-dollar rate drive the base price for everyone, as May 2026 showed.
🧮 Your Petrol Bill: 2014 vs Today
Pick your city and how much petrol you use each month.
The Bottom Line
Petrol is about 40–45% more expensive than in 2014 in every metro, but that’s a slower climb than most everyday costs. The real story isn’t the long-term rise, it’s the volatility: sharp jumps in 2018, 2021 and May 2026, separated by long stretches of nothing. Where you live matters almost as much as when: state taxes alone make Kolkata petrol about ₹11 a litre dearer than Delhi’s.
Frequently Asked Questions
Sources: PPAC — RSP in metro cities since June 2017, PPAC — Delhi prices up to June 2017, DNA (May 2014 metro prices), Dataful (IOC daily prices), India.com (May 2026 hike). Yearly averages calculated by Wellthrise from official daily prices.