
The rising cost of living has been a defining feature of India’s economic journey over the past two decades. While incomes have also grown, the prices of everyday essentials such as fuel, cooking gas, milk and other consumer goods have increased significantly since 2014. (Inflation)
Cost of Living · India
Twelve years of inflation, demonetisation, a pandemic, and global supply shocks — all of it shows up in your grocery bag. We compared 20+ essential products to show exactly how much more (or sometimes less) you’re paying today.
When the UPA government demitted office in May 2014, a litre of petrol in Delhi cost ₹73.16, a cylinder of LPG was around ₹650, and Amul milk was ₹42 per litre. Fast forward to June 2026: petrol is ₹97.77, LPG is pushing ₹900+, and milk has crossed ₹64. The numbers tell a story of compounding price pressure — partially offset by income growth in some sectors, but still deeply felt at the household level.
This post tracks 20+ essential products across food, fuel, dairy, and household spend categories, with data drawn from government parliamentary records, IOC pricing data, CRISIL’s Roti Rice Rate report, and published commodity markets.
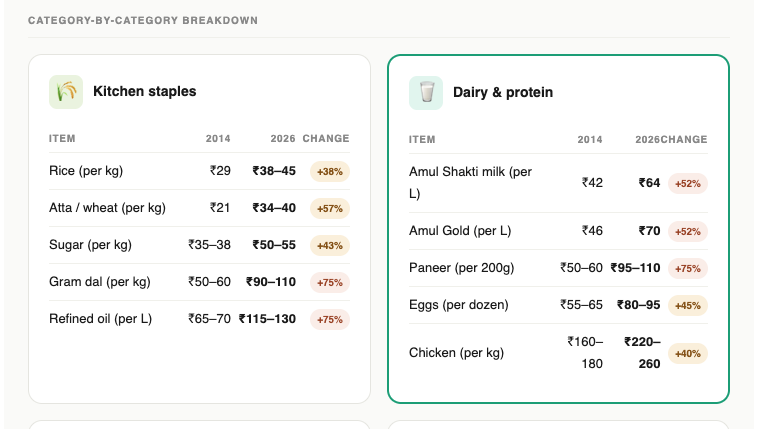
Category-by-category breakdown
| Item | 2014 | 2026 | Change |
|---|---|---|---|
| Rice (per kg) | ₹29 | ₹38–45 | +38% |
| Atta / wheat (per kg) | ₹21 | ₹34–40 | +57% |
| Sugar (per kg) | ₹35–38 | ₹50–55 | +43% |
| Gram dal (per kg) | ₹50–60 | ₹90–110 | +75% |
| Refined oil (per L) | ₹65–70 | ₹115–130 | +75% |
| Item | 2014 | 2026 | Change |
|---|---|---|---|
| Amul Shakti milk (per L) | ₹42 | ₹64 | +52% |
| Amul Gold (per L) | ₹46 | ₹70 | +52% |
| Paneer (per 200g) | ₹50–60 | ₹95–110 | +75% |
| Eggs (per dozen) | ₹55–65 | ₹80–95 | +45% |
| Chicken (per kg) | ₹160–180 | ₹220–260 | +40% |
| Item | 2014 (Jan) | 2026 (avg) | Change |
|---|---|---|---|
| Tomato (per kg) | ₹18–20 | ₹25–35 | +60–70% |
| Onion (per kg) | ₹20–25 | ₹35–50 | +60% |
| Potato (per kg) | ₹12–15 | ₹18–22 | +35% |
Vegetable prices are highly seasonal and can spike 2–3× during peak demand or supply disruptions.
| Item | 2014 | 2026 | Change |
|---|---|---|---|
| Petrol, Delhi (per L) | ₹73.16 | ₹97.77 | +34% |
| Diesel, Delhi (per L) | ₹55.48 | ₹90.67 | +63% |
| LPG cylinder (14.2 kg) | ₹620–680 | ₹880–960 | +40–45% |
| CNG, Delhi (per kg) | ₹41–43 | ₹79.09 | +84% |
| Item | 2014 | 2026 | Change |
|---|---|---|---|
| Cement (per 50kg bag) | ₹280–300 | ₹350–400 | +28% |
| School fee (govt primary, annual avg) | ₹1,500–2,000 | ₹2,500–3,500 | +60% |
| Entry-level smartphone (base) | ₹5,000–7,000 | ₹7,000–9,000 | +28% |
| Auto base fare, Delhi (2 km) | ₹25 | ₹30–40 | +40–60% |
| 1 BHK rent, metro suburb avg/mo | ₹7,000–10,000 | ₹12,000–18,000 | +60–80% |
| Mobile data plan (1 GB/day unlimited calls) | ₹200–300/mo | ₹179–299/mo | −10 to flat |
Mobile/data is the one category that got cheaper in real terms, thanks to the Jio-era price war launched in 2016.
% price increase 2014–2026 at a glance
Retail price change across key essentials. Vegetables excluded due to high seasonality.
Why have prices risen so much?
India’s price story over 12 years is not a single event — it’s a layering of structural pressures, policy changes, and external shocks. Here are the four biggest drivers.
Global commodity shocks
The Russia-Ukraine war (2022) drove edible oil, wheat, and fertiliser prices sharply higher. Middle East tensions in 2025–26 have kept energy markets volatile.
Rupee depreciation
The rupee fell from ~₹60/USD in 2014 to ~₹95/USD in 2026 — a 58% slide — making all imports, especially crude oil and edible oils, significantly pricier.
Fuel tax structure
Heavy central and state excise/VAT on petrol and diesel means retail prices absorb global crude swings almost directly, with limited government buffering.
Supply chain costs
Labour, packaging, logistics, and cold-chain costs rose significantly, especially post-pandemic. FMCG companies have passed most of this on to consumers.
Frequently asked questions
Has inflation been worse under some governments than others?
CPI inflation moderated significantly from double-digit levels (10–12% in 2013–14) to the 4–6% range through most of 2015–2019. However, price increases in the 2019–2024 period were steeper in absolute rupee terms than the earlier decade, particularly for vegetables, cooking oil, and pulses. The rate of inflation was lower, but because it applied to already-elevated base prices, the rupee impact on households was still substantial.
Which essential item has become cheapest relative to 2014?
Mobile data and telecom services are the standout exception. A monthly mobile plan with voice calls and 1–2 GB data cost ₹200–300 in 2014. By 2026, ₹179–299 buys unlimited calls and 1.5–2 GB/day data — a dramatic real-price fall driven entirely by the Jio price war that began in late 2016. Electronics like entry-level smartphones have also risen only modestly compared to food and fuel.
What does this mean for middle-class households?
Households with both earners in the formal sector have generally seen salary growth outpace cumulative inflation over 12 years. Single-income households and those reliant on informal work have found it much harder to keep pace, as essentials (food, fuel, rent) have risen faster than informal wages in many regions. The middle class has also faced new spending categories — EMIs, children’s private schooling, health insurance — that didn’t feature as prominently in 2014 budgets.
Is India’s inflation high by global standards?
India’s headline CPI inflation is currently around 3.4–4.5% (as of mid-2026), which is within the RBI’s 2–6% target band and broadly comparable to peer emerging markets. Food inflation remains elevated at ~3.9%. Over the last decade, India’s inflation has been more controlled than its historical average of 7.2% annually between 1960–2025. But the cumulative price level is significantly higher than 2014 — lower inflation rates don’t mean lower prices, just slower price growth.
Will prices continue to rise in the second half of 2026?
Short-term pressures from Middle East energy tensions, a weaker rupee, and elevated edible oil prices suggest food inflation will remain around 4–5% through late 2026. The RBI has maintained a cautious stance. Domestically, onion prices are expected to rise due to a 4–6% decline in rabi production, while pulses should remain subdued due to higher supplies. The big wildcard remains crude oil — any sustained spike would quickly feed through into CNG, LPG, and transport costs.
Inflation in India 2014 vs 2026
More interesting things on Wellthrise.in
Pingback: Home Loan Overdraft in India (2026): How Home Saver Loans Actually Work - Wellthrise